In a statistical test one quantifies how well observed data agree with the probability of a given hypothesis which is usually called the 'Null hypothesis' H0. Often the validity of the Null hypothesis is considered in comparison to 'alternative hypotheses' H1, H2, etc.
Let's suppose that a set of data x=(x1, ..., xn) has been measured. Any function t(x) is called a 'test statistic' and is a random variable with p.d.f.'s g(t|H0), g(t|H1), etc. The statistical test is formulated as a decision to accept or reject a given Null hypothesis. For this purpose a 'significance level' α is defined which defines in turn the so-called 'critical region' tcut by
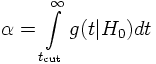
Ex.: In a least squares fit the minimum χ² of the fit is a test statistic. If the observed significance level is considered being too small, or equivalently, the χ² value found is considered too large then one has doubts about the validity of one or more of the assumptions and rejects the fit (goodness-of-fit test). The significance level defining the critical region has of course to be chosen before the goodness-of-fit is made.
If H0 is accepted although it was wrong and another alternative hypothesis H1 is correct one makes an error of the second kind. The probability for this error can be quoted if the alternative hypothesis is known and is given by:

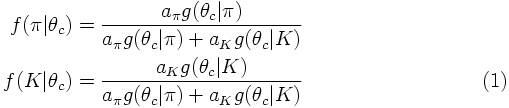
Ex.: In a particle experiment the measurement of the Cerenkov angle θc allows to identify the nature of the particle if its momentum is known. The Cerenkov angle can be used as a test statistic. Let's assume that only two alternative hypotheses are to be considered: H0=pion and H1=kaon. One is then interested e.g. in a kaon selection with high efficiency and with a small misidentification probability for pions. For a given selection efficiency (1-α) the probability for pions to be misidentified as kaons is then fixed. For multi-dimensional test statistics this is not the case: for a given significance level (selection efficiency) the critical region can be optimized such that β becomes a minimum.
The probabilities that a particle with an observed value of θC is a pion or a kaon depend on the relative frequency of pions (apion) and kaons (akaon), respectively, and are given by